

Website performance assessment and monitoring
Website performance assessment and monitoring are crucial components for maintaining a high-functioning digital presence. The speed at which your website loads, its responsiveness across devices, and its overall stability can significantly impact user experience, search engine rankings, and ultimately, conversion rates. By regularly evaluating performance metrics, such as page load times, server response time, and the speed of critical user interactions, businesses can identify bottlenecks and implement necessary optimizations. Tools like Google PageSpeed Insights, GTmetrix, and Pingdom offer valuable insights into various performance aspects and provide actionable recommendations for improvement.
Moreover, ongoing monitoring is essential, as website performance can fluctuate due to numerous factors including server issues, increased traffic, or changes made in the backend. By setting up routine performance checks and utilizing monitoring tools that alert you to downturns, businesses can proactively address issues before they lead to a poor user experience. Things like uptime monitoring and transaction tracking not only help in identifying performance dips but also enable websites to maintain optimal functionality during peak usage. Ultimately, a solid performance assessment and monitoring strategy ensures a seamless experience for users, fostering engagement and loyalty while bolstering your SEO efforts.
Unlock Web Analytics for New Jersey Businesses — Turn Website Data into Local Leads and Revenue
Web analytics converts website and marketing activity into clear, actionable decisions that raise visibility and drive local leads for New Jersey businesses. This guide walks through what web analytics is, how it works, and why NJ small businesses should adopt it to sharpen local SEO, track conversions, website monitoring and coordinate multi-channel campaigns. You’ll find practical tool recommendations, examples of how AI sharpens insight, step-by-step lead-generation workflows, and tailored analytics playbooks for contractors, law firms, HVAC, medical practices, and manufacturers across New Jersey. We also include comparison charts, checklists, and a privacy-first implementation plan for 2026 — plus real case-study results and instructions to book a MarketMagnetix Media Group strategy session that turns data into measurable leads and revenue.
Why web analytics matters for New Jersey small businesses
Web analytics measures and interprets online behavior — pages viewed, events fired, search queries, referral sources, and conversions — so teams can make marketing and product choices that produce local leads. It captures event-level signals (pageviews, clicks, form submissions, phone calls) and rolls them up into dashboards and reports that show which channels and pages actually bring customers. For New Jersey small businesses, that means identifying which local keywords, landing pages, and paid campaigns generate booked calls or form leads — then shifting budget toward the highest-value paths. The sections below break down how analytics drives local growth and which KPIs NJ operators should focus on.
Web analytics delivers these practical advantages for New Jersey businesses:
- Quicker clarity on which local keywords turn into calls and appointments.
- Evidence-based budget allocation across organic search, Maps, and paid channels.
- Measured improvements from landing-page and on-site funnel changes.
Those outcomes make analytics a day-to-day priority for any New Jersey business serious about predictable lead generation. Next, we’ll unpack how those results are produced.
How web analytics powers local business growth in New Jersey
Analytics connects online signals to offline results — phone calls, bookings, and quotes — so teams optimize for real revenue, not vanity metrics. Event tracking, call tracking, and CRM integration let businesses attribute leads to specific pages, campaigns, or local search queries, reducing wasted ad spend and increasing booked work. For example, when a contractor or HVAC company tracks which service pages lead to phone calls, they can push those pages in local SEO and paid ads. Those data-driven updates raise conversions, which in turn create more data to optimize — a repeatable growth loop.
Because New Jersey markets differ by service area, seasonality, and referral patterns, analytics also enables hyper-local segmentation and A/B testing of location pages. Over time that produces steady lifts in local visibility and conversion rates that compound.
Key online marketing metrics New Jersey businesses should track
Tracking the right KPIs turns activity into outcomes and fuels continuous improvement across SEO, ads, and site experience. For NJ small businesses, the highest-impact metrics focus on lead flow and lead quality, not just raw traffic. Choosing the right metrics ensures time and budget go to channels that generate appointments and revenue. Below is a short checklist of the metrics to monitor, followed by guidance on prioritization.
- Conversion rate: Share of sessions that become leads via form, call, or booking.
- Leads per channel: Qualified leads attributed to organic search, paid, Maps, and referrals.
- Call-tracking metrics: Source, call duration, and conversion outcome for phone leads.
- Local search impressions and clicks: Visibility in Maps and local SERP features.
- Lead-quality indicators: Appointment show rate, closed-won rate, and revenue per lead.
Review these metrics weekly to spot trends and guide experiments on pages and paid campaigns. Prioritize metrics that move revenue — leads per channel and lead quality — and use supporting signals like impressions and session behavior to diagnose problems.
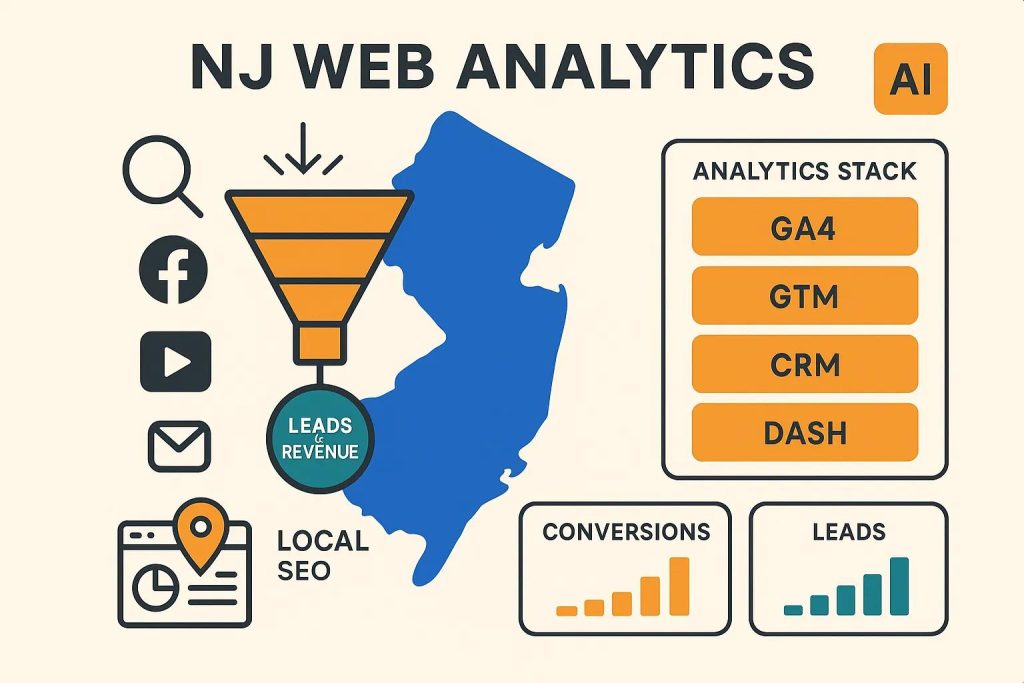
Which analytics tools work best for New Jersey small businesses?
Picking the right toolset balances platform capability, implementation effort, and how well the tools support local lead tracking for a small team. A typical stack includes Google Analytics 4 for event-based web measurement, Google Tag Manager for implementation control, a CRM to aggregate leads and attribute revenue, and paid-ad dashboards for campaign performance. The right stack depends on your resources, attribution needs, and whether CRM integration is required to close the measurement loop. The table below matches common platforms to New Jersey business needs.
Intro: The table below pairs platforms with use cases, focusing on measurement, integration, and price-tier expectations for NJ businesses.
| Platform | Best for / Key Features | Use case for NJ businesses |
|---|---|---|
| Google Analytics 4 (GA4) | Event-based tracking, audiences, conversion-path analysis | Core web measurement for organic and paid attribution |
| Google Tag Manager | Flexible tag management, precise event firing | Deploy call tracking and form events without lengthy developer cycles |
| CRM Analytics (generic) | Lead aggregation, lifecycle reporting, revenue mapping | Connect online leads to offline outcomes for contractors and law firms |
| Paid platform dashboards | Campaign metrics, ROAS, conversion tracking | Measure and optimize paid search and local display efforts |
Top analytics platforms for NJ local businesses
In practice, start with GA4 for event-driven insight, use GTM to deploy events and call-tracking pixels, and add a CRM to reconcile leads with closed revenue. GA4 handles sessions and events well, while GTM reduces implementation friction so marketers can iterate without constant developer support. CRM analytics ties online signals to appointments and sales so attribution reflects real business outcomes. Complexity varies: GA4 and GTM are achievable for in-house teams with some technical help, while CRM integrations often need configuration or partner support for advanced attribution.
A phased rollout — GA4 and GTM first, then call tracking, then CRM attribution — lowers risk and delivers early wins that fund automation and AI optimization later.
How AI improves analytics insights for New Jersey businesses
AI improves analytics by automating anomaly detection, predicting lead quality, and surfacing the highest-impact optimization opportunities faster than manual review. Models can analyze historical event sequences to predict which sessions are most likely to convert, enabling predictive lead scoring and smarter follow-up. AI-driven anomaly detection shortens time-to-action by flagging sudden drops in local impressions or spikes in form abandonment that need immediate fixes. Automated reports and plain-language summaries keep small teams informed without building complex dashboards.
Use AI responsibly: validate model outputs against actual outcomes and let predictions augment — not replace — human judgment so seasonality and local context remain central to decisions.
How New Jersey businesses can use web analytics to improve lead generation
Analytics becomes a lead engine when measurement connects to iterative testing and channel optimization. Start by instrumenting every conversion point — forms, click-to-call, appointment schedulers — and standardize event names and UTM parameters for clear channel attribution. Define conversion value tiers (lead, qualified lead, appointment, closed sale) and map them in your CRM to measure leads-per-channel and revenue-per-lead. Attribution models let teams shift budget toward channels that deliver the best downstream value instead of the most last-click credit. The table below maps core metrics to their direct impact on lead generation to help prioritize actions.
Intro: Use this mapping to link analytics metrics to concrete lead-generation choices and budget decisions.
| Metric / Model | What it Measures | How it impacts lead generation |
|---|---|---|
| Conversion Rate | Share of sessions that produce leads | Helps prioritize landing pages and traffic sources |
| Leads per Channel | Number of leads by source | Informs budget shifts toward high-performing channels |
| Lead Velocity | Rate at which leads arrive over time | Guides resource planning for follow-up teams |
| Attribution Model | How credit is assigned across touchpoints | Improves multi-channel budget allocation |
Once you map metrics to actions, set a regular cadence for experiments, measurement, and iterative budget reallocation to steadily improve both lead quantity and quality.
Local SEO analytics tactics to drive more NJ leads
Local SEO analytics centers on Google Business Profile signals, local keyword performance, and on-page location relevance to convert Map and organic visibility into leads. Track GBP metrics — impressions, views, calls — and tie them to landing pages with UTM parameters to see which listings actually produce appointments. Treat location pages separately and A/B test headlines, local schema markup, and prominent calls-to-action to raise conversions. Run citation audits and monitor reviews to keep NAP consistency and trust signals strong, which influences click-throughs and conversions.
These monitoring tactics let New Jersey businesses respond to shifting local intent and amplify the pages that consistently convert visitors into callers or bookings.
Multi-channel attribution models for New Jersey businesses
Attribution assigns credit for leads and is essential for smarter budget decisions across search, Maps, social, and paid channels. Small teams can start by comparing simple models — last click, linear, time decay — to understand how credit moves, then upgrade to data-driven attribution as data volume allows. For many NJ SMBs a blended approach works: use last-click for short-term campaign reporting, but evaluate multi-touch and data-driven models for strategic budget planning. Proper attribution needs consistent UTM tagging, CRM integration, and a conversion-value framework so each channel’s contribution to revenue is measurable.
Begin with practical setups that match your team’s capacity and adopt advanced attribution as measurement maturity grows.
Industry-specific analytics strategies for NJ contractors, law firms, HVAC, medical, and manufacturing
Analytics strategies should reflect each industry’s conversion behavior and regulatory or operational constraints. Contractors and HVAC firms depend on phone leads and seasonality; law firms and medical practices prioritize consult requests and appointments while staying privacy-conscious; manufacturers track quote requests and B2B qualification steps. Regardless of vertical, the goal is the same: instrument the unique conversion events, map them to CRM outcomes, and build dashboards that surface the most predictive revenue indicators. The table below lists industry-specific metrics and example KPI aims to help teams prioritize tracking and reporting.
Intro: This table shows the most relevant metrics per industry and example KPI aims to guide dashboard design and optimization.
| Industry | Top Metrics to Track | Example KPI aims |
|---|---|---|
| Contractors / HVAC | Calls, booked estimates, job source by campaign | Increase booked estimates by 25% in peak season |
| Law Firms | Consult requests, form completions, call duration | Raise qualified consults while maintaining lead quality |
| Medical Practices | Appointment bookings, no-show rate, referral source | Improve bookings and reduce no-show rates by 10% |
| Manufacturing | Quote requests, lead qualification stages | Shorten lead-to-quote cycle and increase quote conversions |
Using these industry checklists helps dashboards surface the metrics that map directly to business performance and support faster, domain-aware decisions.
Custom analytics approaches for NJ contractors and HVAC companies
Field-service businesses like contractors and HVAC teams benefit from tracking booking sources, appointment conversion rates, and seasonal campaign performance so scheduling and inventory align with demand. Implement call tracking with source attribution so you can see which search terms or ads produce phone leads that convert to jobs. Geo-targeted landing pages and service-area segmentation let teams measure performance by ZIP code and run targeted promotions where ROI is highest. Tracking scheduling funnels and lead-to-job close rates closes the loop between marketing spend and operational outcomes — critical for optimizing both ads and dispatch planning.
These domain-specific implementations reduce friction between leads and field operations, improving conversion rates and operational efficiency.
Web analytics best practices for NJ law firms and medical practices
Law firms and medical practices require careful lead qualification, appointment-scheduling tracking, and privacy-safe practices that avoid storing sensitive information in analytics tools. Track consultation requests and form completions using non-identifying event data and map outcomes in the CRM without putting protected health or legal details into analytics platforms. Emphasize trust signals on service pages, clear appointment CTAs, and simple contact paths to reduce friction and lift conversions. Use event-level data (click-to-call, confirmation pages) to measure effectiveness while keeping lead handling secure and compliant.
Following these practices preserves client trust and still gives you accurate measurement of which content and campaigns generate qualified consultations.
How case studies show the real impact of web analytics for New Jersey businesses
Case studies turn claims into concrete outcomes by showing before/after metrics from analytics-driven interventions. Typical examples list baseline traffic and lead rates, the analytics and optimization steps taken (tooling, event tracking, attribution changes, AI insight), and the resulting lift in leads, conversion rate, and revenue. Showing timeframes and repeatable methods helps other New Jersey businesses judge whether similar gains are realistic. The sections below describe success narratives and ROI snapshots that reflect common results from focused analytics engagements.
Case evidence adds credibility to analytics recommendations and maps the path from measurement to profitable action.
Success stories: NJ small businesses using AI-enhanced analytics
Across industries, AI-enhanced analytics has produced measurable uplifts by highlighting high-impact issues and prioritizing experiments. In practice, AI anomaly detection uncovers sudden traffic-quality shifts that went unnoticed, while predictive lead scoring helps sales focus on the highest-intent contacts. These interventions often increase appointment rates, lower cost-per-qualified-lead, and speed lead-to-sale cycles by concentrating human effort where it matters. Sharing the metrics and steps taken makes these results repeatable for other New Jersey businesses pursuing similar improvements.
The repeatable sequence is simple: instrument, analyze (with AI where appropriate), act on prioritized opportunities, and measure the impact.
Measurable ROI from MarketMagnetix web analytics services
MarketMagnetix Media Group is a New Jersey-based digital agency focused on data-driven marketing for local businesses. Our analytics services include consulting and implementation, AI-enhanced optimization, and strategy sessions designed to improve visibility and lead generation for NJ small businesses across contractors, law firms, HVAC, medical practices, and manufacturers. By combining measurement best practices with AI insights and CRM integration, we help clients convert traffic into higher-quality leads and measurable revenue gains.
If your team values case-study evidence and a consultative approach, a focused strategy session can surface comparable ROI opportunities and deliver a prioritized implementation roadmap.
How to book a personalized web analytics strategy session in New Jersey
Booking a strategy session moves diagnostic findings into prioritized actions tailored to your goals. A productive session starts with discovery, a quick analytics audit, prioritized recommendations, and a roadmap with measurable milestones. Preparing in advance — granting analytics and CRM access, gathering recent campaign data, and clarifying primary KPIs — speeds the session and increases value. The subsections below outline the session agenda and a checklist to prepare your team for analytics optimization.
These preparation steps help ensure a strategy session delivers immediate, actionable next steps rather than vague suggestions.
What to expect in a web analytics strategy session with MarketMagnetix
Our sessions include discovery questions, a concise analytics audit, priority recommendations, and a follow-up plan with measurable actions. The agenda typically covers account access review, verification of key conversion points, a snapshot of attribution and reporting gaps, and a short list of prioritized fixes plus a roadmap for implementation and measurement. Deliverables usually include high-impact technical fixes, recommended tracking changes, and a timeline for AI optimization and CRM integration. To proceed, New Jersey businesses can schedule a session with MarketMagnetix to receive a tailored analytics roadmap and prioritized implementation plan.
This clear agenda sets expectations and makes it easy to evaluate the session’s impact on lead generation and visibility.
How to prepare your New Jersey business for analytics optimization
Good preparation saves time and increases session effectiveness by letting the team validate hypotheses quickly and implement prioritized changes. Before the session, gather access to analytics accounts, a list of primary KPIs, recent campaign details, and contact information for stakeholders responsible for follow-up. Also collect recent monthly reports, sample leads, and CRM access or an export so online events can be tied to offline outcomes. Having these materials ready helps produce prioritized actions you can implement within weeks.
Being prepared shortens the path from insight to impact and speeds measurable lead-generation improvements.
Checklist to prepare for your strategy session:
- Provide analytics and tag manager account access to the consulting team.
- Compile primary KPIs and recent campaign performance summaries.
- Export recent CRM lead records or grant CRM access to link online leads to outcomes.
Frequently Asked Questions
1. How can small businesses in New Jersey ensure compliance with privacy regulations when using web analytics?
Follow applicable privacy rules like CCPA and GDPR by asking for consent before collecting personal data, publishing a clear privacy policy, and offering opt-out choices. Anonymize data where possible and confirm third-party analytics vendors meet compliance standards. Regular audits of data practices help maintain compliance and build customer trust.
2. What are the common challenges New Jersey businesses face when implementing web analytics?
Typical issues include limited technical know-how, difficulty integrating multiple data sources, and internal resistance to change. Small teams may struggle to pick tools that fit their needs and budget, and interpreting data correctly can be daunting. To overcome these barriers, consider professional consulting or targeted training to raise internal analytics capability.
3. How can businesses measure the effectiveness of their web analytics strategies over time?
Define clear KPIs tied to your goals — conversion rate, lead quality, and customer acquisition cost — and review them regularly to track performance trends and guide decisions. Use A/B testing to validate changes and set periodic analytics reviews to identify improvement opportunities and confirm the impact of optimizations.
4. What role does user experience play in web analytics for lead generation?
UX directly affects conversion rates: a smoother experience increases engagement and the likelihood of conversion. Analytics highlights UX issues through metrics like bounce rate and time on page. Use that data to improve navigation, content layout, and calls-to-action, which in turn boosts lead generation and customer satisfaction.
5. How can New Jersey businesses leverage AI in their web analytics efforts?
AI can analyze large datasets to reveal patterns and insights that are hard to spot manually. Use machine learning for anomaly detection, predictive analytics, and customer segmentation to prioritize work and forecast trends. AI-assisted lead scoring and automated reporting free your team to focus on strategy and follow-up that drive ROI.
6. What are the best practices for setting up a web analytics dashboard?
Start with clear objectives and select a handful of KPIs that align with business goals. Choose a dashboard platform that’s easy to read and customize for real-time trends. Keep the layout focused on decision-making metrics, update it as priorities shift, and train team members to interpret the data accurately.
7. How can businesses in New Jersey use web analytics to enhance their local SEO efforts?
Track local-search performance — impressions and clicks from Google Business Profile and Maps — and map those signals to landing pages with UTM parameters to see which listings yield appointments. Analyze which keywords drive conversions and A/B test page elements like CTAs and local schema. These steps improve local rankings and increase lead generation from nearby customers.


